This is a story of two graphs. From these graphs it is possible to know in general terms something that is going to happen with almost total certainty. When it will happen is not so certain but probably sooner than later. It will be an unpleasant shock for most people and there will be consequences for all of us, so two graphs. The first one is from the US National Atmospheric and Oceanographic Administration (NOAA). It is the record of the heat energy in the top 2000 meters of the oceans:
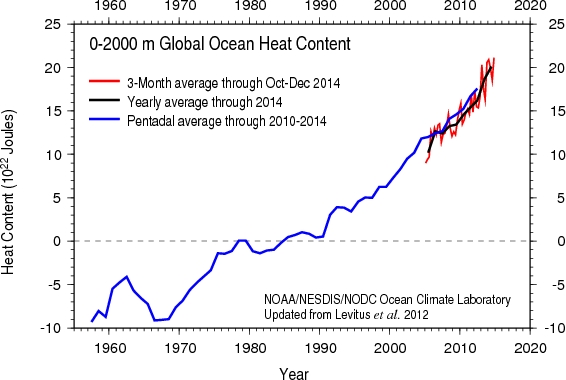
This is nothing to do with a computer model, it is the global average data collected from a progressively more accurate and wider sample. Since the 1990’s the Argo float measuring system has given us a very accurate and reliable graph with a truly global sample. If you would like to understand in detail the credibility of this graph then Google A Review of Global Ocean Temperature Observations: Implications for Ocean Heat Content Estimates and Climate Change, this should lead you to a downloadable pdf at the American Geophysical Union (it is free to download thanks to the Guardian Newspaper). The Oceans are the largest thermal reservoir on the planet, some 90 times greater than the atmosphere. The top 2000 meters of the Oceans represent a thermal reservoir at least 30 times bigger than the whole of the atmosphere. The red line shows the small variations within each year but not beyond each year cycle. The point of the graph is this, up to the 1970’s there was natural variation over several years, it warmed a bit then cooled bit over the decades, since then the recorded heat energy rises in an almost straight line upwards to date.
Now let us look at the near surface global average temperature record as a graph:
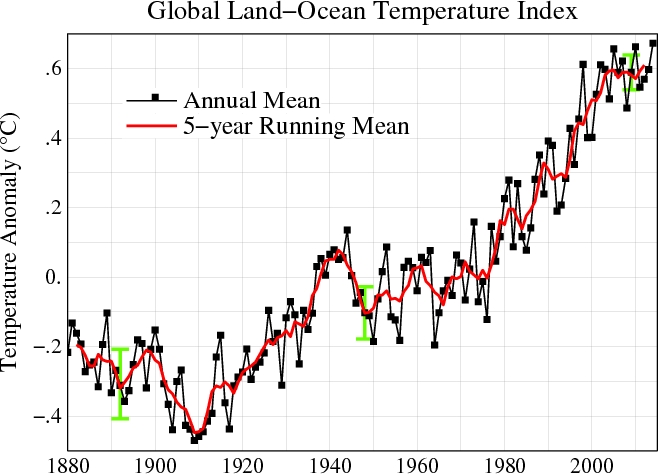
This graph is from the Goddard Institute for Space Science (GISS) which is part of NASA. This is not from a computer model but a global average of recorded air temperatures near the land and ocean surface. It covers a longer time period (1880- ), than the ocean heat (1955- ). The air temperature is much more spiky that the ocean heat. It shows substantial natural variation year to year and over many years, in particular notice the drop in temperature from 1880 to 1910 followed by a rise until 1940 followed by another fall till 1950.
There has long been an awareness of cycles or oscillations in the climate. In the UK there is an oscillation over about 60 to 70 years which now goes under the name of the Atlantic Multidecadal Oscillation (AMO). Although no one really knows what causes them it is most likely something to do with a long term eddy or cycle in the overturning Atlantic circulation. The result is that every 60-70 years we get 10-20 years of exceptionally cold winters which are also associated with long hot summers. The last time this happened was during World War 2 beginning in the winter of 1939-40, the peak cold winter was 1947 and it ended in the mid 1950’s. Before that there were the Victorian and Dickensian cold winters that peaked about 1880. Before that there are no measured temperature records but there is evidence of freezing rivers and bee killing winters peaking in 1813 in Europe. According to this cycle we should be somewhere around the peak of a series of exceptionally cold winters right about now. If you notice on the graph the temperature levels off in 2000 but does not show the drop in global temperatures that is evident in the 1940’s or following the 1880 peak. There are also decadal oscillations in the Pacific and all these interact to affect the global average.
The levelling off of global air temperature from 2000 to date has been seized on as evidence that climate warming has stopped. This would be good news if it was true. Unfortunately the warming has not stopped all that has been happening is that the Ocean oscillations have been masking the warming. If there were not greenhouse gas induced warming we would have seen the global air temperature drop in the last few years. We can know this almost with total certainty because of the reliable ocean heat record which shows no decline or variation.
This in itself is bad news but the oscillation will now change from masking the warming to reinforcing it. It is not possible to know exactly when this change will happen but it will be sooner than later. The UK Met Office researches recently published a paper that suggested that there is a 75% chance that the change will happen before 2020.
What are the conclusions here?
Firstly, the GHG warming has not stopped or paused, this is clear from the ocean heat content record.
Second, the apparent pause has been due to natural variation within the climate and oceans. This will soon change over and the near surface air temperature will rise more rapidly than previously.
Thirdly, there will be consequences when the warming appears to accelerate. Scientific estimates suggest that the global average temperature could rise at a quarter of a degree Celsius per decade for several decades. That would be very noticeable. Whatever the actual rate there will be a serious warming spike in the coming years.
Finally the spike may well lead to panic and more direct action but if protest continues to be ignored and suppressed it will lead to violence, action and then reaction by the state. Leading to a situation where both sides give up on peaceful change. Where chaos, blame and extreme politics dominate what gets done.
The lesson for us now is that we will need to have established opportunities on the ground for people to join before this shock happens. In this case nature will supply the shock and it presents an opportunity to turn the shock doctrine to positive use. However if it is not used for good it will certainly be exploited by reactionaries to further repressive and exploitative agendas. The point is that establishing pathways for ordinary people to change behaviour and “walk away” will need to be in place before the shock hits. Any ‘’solutions’’ chosen will only be from the range of “solutions” existing at that time.
